Why Fort Wayne Businesses Choose Our Analytics
Turn data into your competitive advantage with transparent, actionable insights
Data Transparency
Complete visibility into marketing performance with clear, actionable metrics
Informed Decisions
Make strategic choices based on real-time data and comprehensive analytics
Prove Marketing ROI
Demonstrate clear return on investment to stakeholders and leadership
Identify Opportunities
Spot growth opportunities and optimization areas through data analysis
Track KPIs
Monitor key performance indicators aligned with your business goals
Visual Insights
Easy-to-understand charts and graphs that tell your data story
Custom Metrics
Track what matters most to your specific business objectives
Stakeholder Reporting
Professional reports tailored for executives, boards, and investors
Our Analytics Implementation Process
From KPI definition to actionable insights in 3 weeks
KPI Definition
Identify key metrics aligned with your business goals and marketing objectives
Dashboard Setup
Configure custom analytics dashboards with real-time data integration
Data Integration
Connect all marketing channels and data sources for comprehensive tracking
Reporting & Insights
Deliver regular reports with actionable insights and recommendations
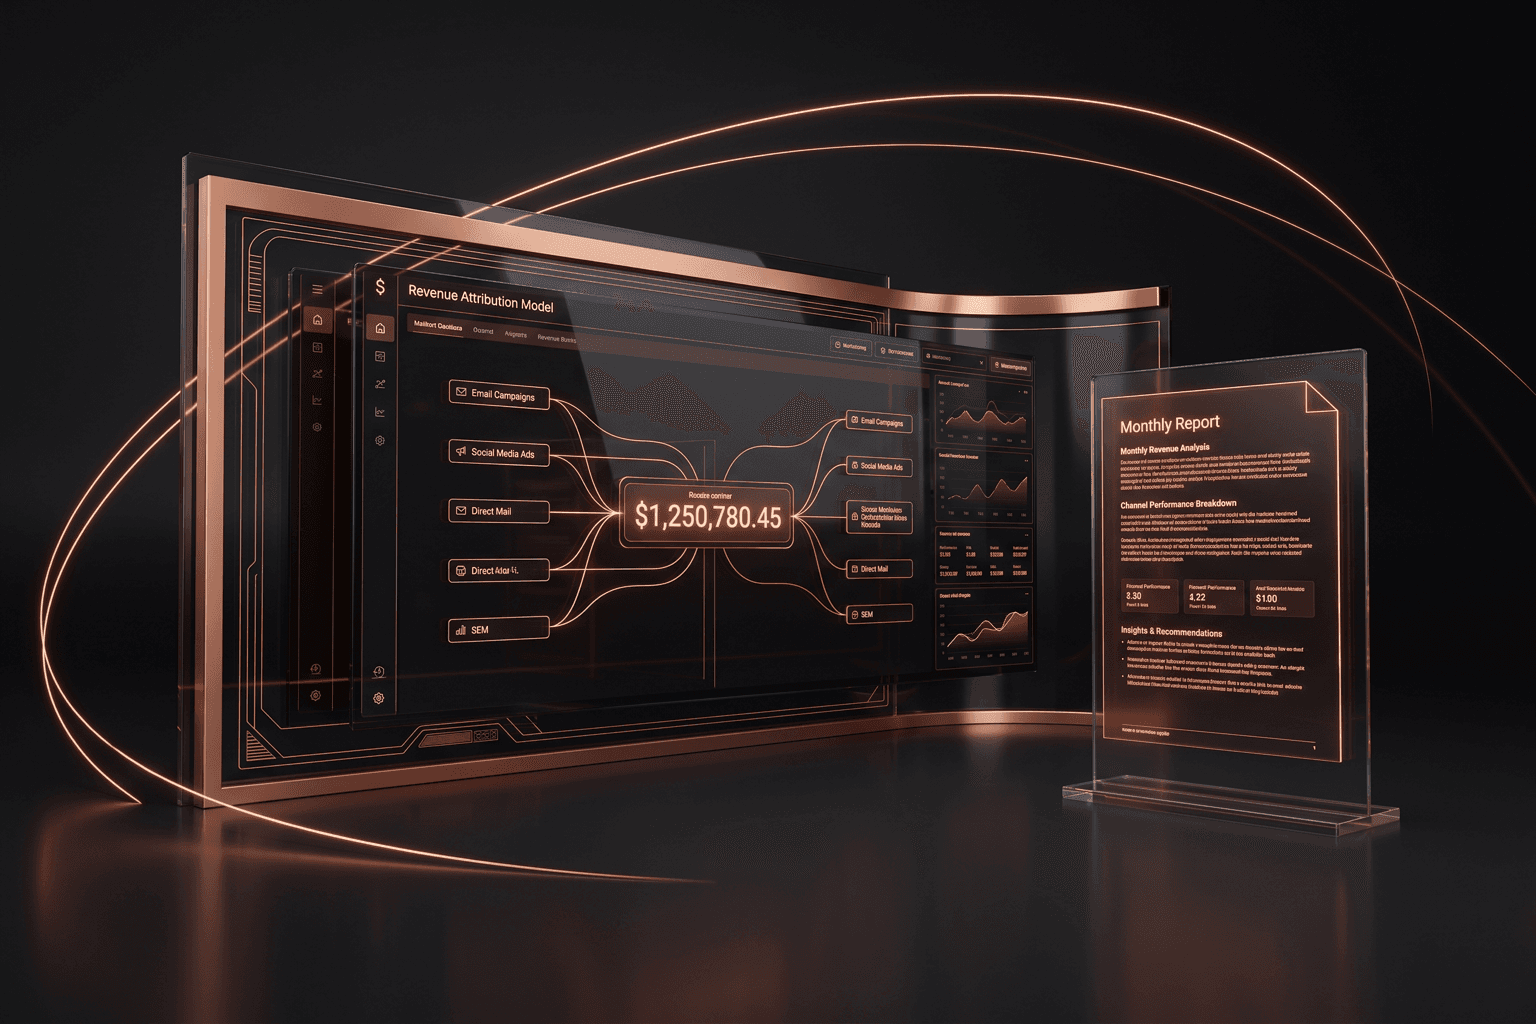
Sample Analytics Dashboard
See how we transform complex data into clear, actionable insights
Channel Performance
Top Metrics
Analytics Plans for Every Business
From basic dashboards to enterprise BI solutions
Starter Dashboard
- ✓Basic analytics dashboard
- ✓Monthly performance report
- ✓5 key metrics tracked
- ✓Google Analytics setup
- ✓Email report delivery
- ✓Quarterly strategy call
- ✓Basic data visualization
- ✓Mobile-friendly dashboard
Professional Analytics
- ✓Advanced analytics dashboard
- ✓Weekly insights reports
- ✓15+ custom metrics
- ✓Multi-channel integration
- ✓Real-time data updates
- ✓Monthly strategy sessions
- ✓Custom data visualization
- ✓Automated report scheduling
- ✓Goal tracking & forecasting
- ✓Competitor benchmarking
Enterprise BI
- ✓Custom BI platform
- ✓Real-time analytics dashboards
- ✓Unlimited custom metrics
- ✓Advanced data integration
- ✓Predictive analytics & AI
- ✓Weekly strategy sessions
- ✓White-label reporting
- ✓API access & automation
- ✓Custom data warehouse
- ✓Dedicated analytics manager
- ✓Board-ready presentations
- ✓Advanced forecasting models
Fort Wayne Success Stories
See how local businesses use analytics to drive growth
Fort Wayne Manufacturing CEO
Challenge: Needed clear ROI visibility to guide $500K marketing budget decisions
Solution: Built executive dashboard with real-time KPIs, revenue attribution, and predictive analytics
- 40% revenue growth after data-driven strategy pivot
- Reduced wasted ad spend by $75K annually
- Board approved 2x marketing budget increase
- Dashboard used in quarterly investor presentations
Fort Wayne Marketing Team
Challenge: Managing 12+ marketing channels without unified performance visibility
Solution: Integrated multi-channel dashboard with automated weekly reports and optimization recommendations
- 30% efficiency improvement in campaign management
- Identified underperforming channels saving $50K
- Reduced reporting time from 8 hours to 30 minutes
- Data-driven decisions increased conversion rate 25%
Fort Wayne Startup Founder
Challenge: Needed investor-ready metrics and growth projections for Series A fundraising
Solution: Created board-level dashboard with growth metrics, cohort analysis, and forecast modeling
- Secured $2M Series A funding using data presentations
- Investor confidence increased with transparent metrics
- Identified 3 high-growth opportunities before competitors
- Board meetings reduced from 3 hours to 90 minutes
Enterprise-Grade Analytics Tools
Best-in-class platforms for comprehensive data analysis
Google Analytics 4
Advanced web and app analytics with AI-powered insights
Google Data Studio
Interactive dashboards and beautiful data visualizations
Tableau
Enterprise-grade business intelligence and analytics platform
Power BI
Microsoft analytics service with advanced reporting capabilities
Google Tag Manager
Event tracking and conversion measurement automation
Supermetrics
Marketing data integration from 100+ platforms
Mixpanel
Product analytics and user behavior tracking
Custom Dashboards
Proprietary analytics solutions tailored to your needs
Frequently Asked Questions
Everything you need to know about ROI reporting
What metrics do you track in ROI reporting?
We track comprehensive metrics including revenue attribution, conversion rates, customer acquisition cost (CAC), lifetime value (LTV), channel performance, engagement metrics, traffic sources, goal completions, and custom KPIs specific to your business. Each dashboard is customized to focus on the metrics that matter most for your goals.
Can I customize my analytics dashboard?
Absolutely! All dashboards are fully customizable to track your specific KPIs and metrics. We work with you to identify the most important data points for your business and create visualizations that make sense for your team. You can request changes and updates at any time.
How real-time is the data in my dashboard?
Data refresh rates depend on your plan and data sources. Professional plans include hourly updates, while Enterprise plans offer real-time data streaming. Most marketing platforms update within 24 hours, though some metrics like website traffic can be near real-time.
What platforms can you integrate into reporting?
We integrate all major marketing platforms including Google Analytics, Google Ads, Facebook Ads, LinkedIn Ads, email marketing tools, CRM systems, e-commerce platforms, and more. Enterprise plans can integrate virtually any data source through custom APIs.
How often will I receive reports?
Report frequency depends on your plan: Starter includes monthly reports, Professional includes weekly insights, and Enterprise includes daily/weekly reports plus on-demand access. All plans include 24/7 dashboard access to view real-time data.
Who has access to my analytics dashboard?
You control all access permissions. We can set up multiple user accounts with different permission levels for your team, executives, or stakeholders. Enterprise plans include white-label options for client-facing dashboards.
Do you provide training on using the dashboard?
Yes! All plans include initial dashboard training, and Professional/Enterprise plans include ongoing training sessions. We provide video tutorials, documentation, and live support to ensure your team can effectively use all analytics features.
What's the total cost including setup?
Setup fees range from $500-$2,500 depending on complexity and integrations needed. Monthly costs are as listed in our pricing tiers. We provide detailed proposals outlining all costs before starting any work. Many businesses see ROI within the first month through optimized marketing spend.
Transform your digital presence
Ready to Transform Your Data Into Growth?
Schedule a free analytics consultation and see how we can help you make data-driven decisions.
Guides & Resources
The Only 7 Marketing Metrics a Fort Wayne Business Owner Needs to Track
Seven numbers that tell you if your marketing is actually working, each defined in one plain-English sentence, with healthy ranges and a worked example.
Read the guide- Complete guide
Online Reviews & Reputation: The Complete Guide for Fort Wayne Businesses
How Fort Wayne businesses get more Google reviews, handle bad ones the right way, and turn a strong reputation into measurable revenue.
Read the guide How to Respond to Negative Google Reviews: Copy-Paste Templates for Indiana Businesses
Word-for-word response templates for every negative-review scenario Indiana businesses face, plus the rules that keep you out of trouble.
Read the guide